Gun Laws in 20 different countries

|
This coding project came out of a request from my interactive desk editor in the USC Annenberg Media Center. In the aftermath of the shooting in New Zealand she wanted an interactive map of gun laws in different countries. When I showed her the initial design she said it was better than she originally imagined it.
I did all the coding myself, and had plenty of help with the information gathering. Overall, this really stretched my coding muscles and I'm proud of what I was able to accomplish. |
Rerouted: Data shows passengers being bumped off of flights is on the decline after United scandal
|
This project started just as a text piece for one of my class in my fall semester at USC. I decided to make it into an interactive piece for the interactives desk in the Annenberg Media Center. I'm very proud of this project because I experimented with a lot of new plugins and techniques in HTML, CSS and jQuery.
|

|
Too Hot for School: How increasing temperatures due to climate change are affecting kids' ability to learn
|
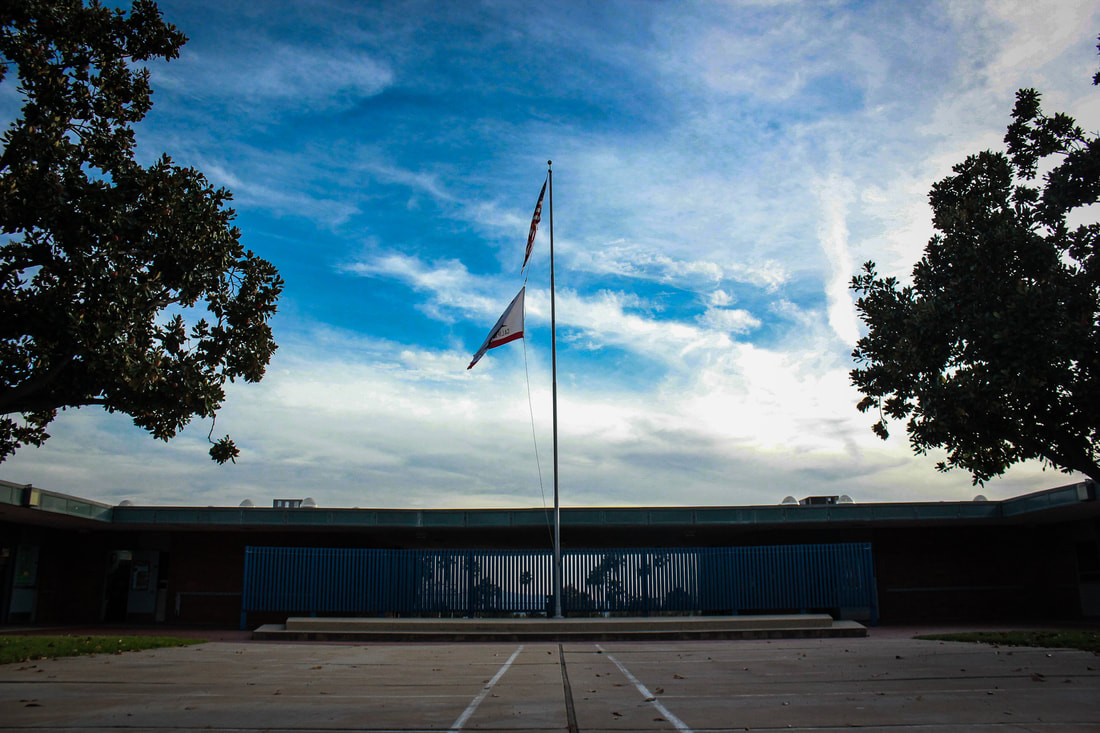
For my final project for the fall semester of my masters program at the University of Southern California, I decided to do a story about the intersection of education and climate change. Because although the Los Angeles Unified School District has plenty of initiatives to help students learn about climate change, if they don't have air conditioning, if it's too hot to go outside for recess or both, it's a lot harder for them to learn.
This is one of my favorite projects, and I'm especially proud of the map, slider (made to look kind of like a thermometer), and design. USC Annenberg Media's interactive desk also published it. |
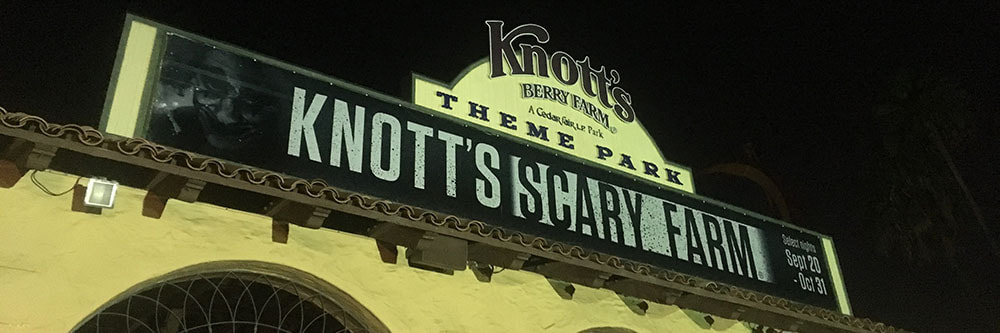
Holiday Horrors: Larger crowds may account for spike in knott's berry farm Crime
|
This story started out as a project for my intro to data journalism class in grad school. The school project was more about Disneyland, but my reporting partner and I found a more interesting angle in Knott's Berry Farm data, in the spike in crime in October, during the "Knott's Scary Farm" Halloween event. |
|
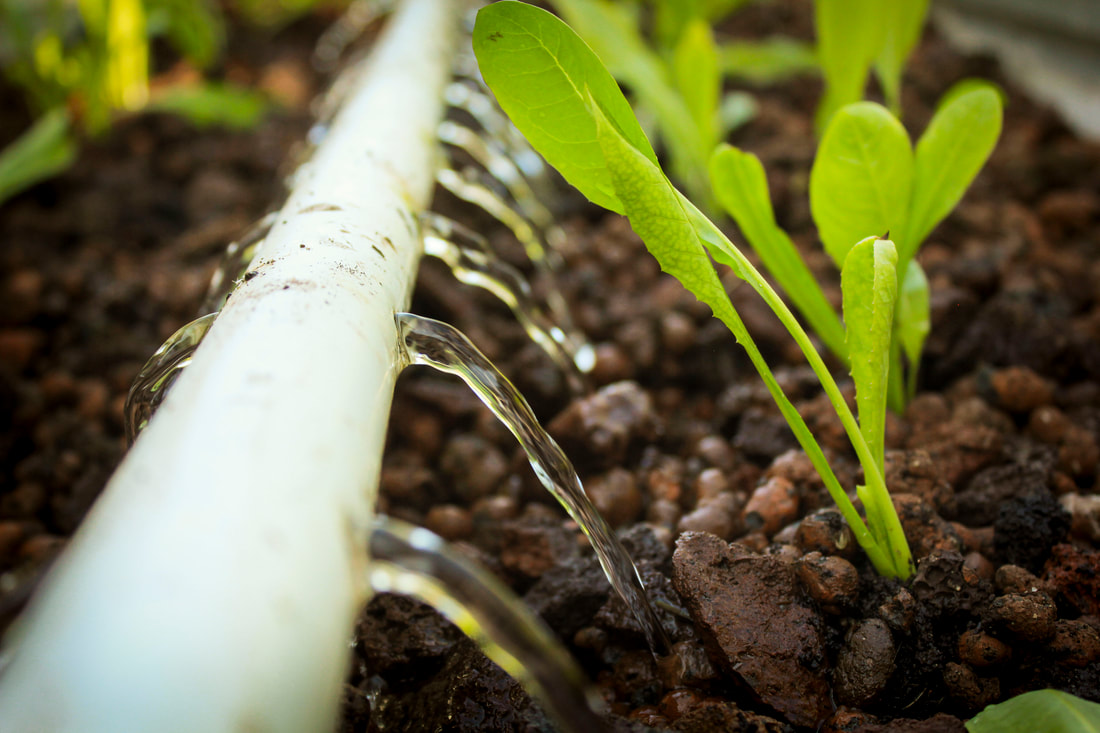
WARMER IS NOT ALWAYS BETTER: HOW CLIMATE CHANGE IS AFFECTING FARMING IN SOUTHERN CALIFORNIA
|
My midterm project for my master program at the University of Southern California was about how climate change is affecting farming in the area. Many farmers have recognized a disconnect between the knowledge of farmers and the rest of the community. They have realized that most people either don't know or don't think about farming when they think about climate change. Most consumers don't know how much water farmers need, or how the heat affects crops, or even what fires can do to bee hives - which are an essential part of the agriculture system. For example, farmers pay for water by acre-feet, which is the amount of water needed to fill up an acre worth of land with a foot of water. It works out to nearly 326,000 gallons. But it doesn't rain on just one acre of land at a time. The 50 percent decrease in overall rainfall over 12 acres (the median size of a farm in Ventura County) works out to over 3 million gallons of water that the farms now have to pay for. |
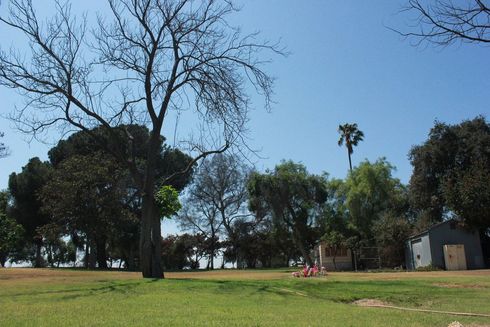
A CITY OF FORGOTTEN ANGELS: THIS IS WHAT HAPPENS WHEN LOS ANGELES' HOMELESS DIE
|
This story was for my summer immersion class at USC's M.S. in Journalism program.
Professors randomly split us up into groups of about five and gave us an umbrella topic: Beyond Skid Row: Homelessness in Southern California. From there, each group had to come up with their own pitch and work on the project over about six weeks. Our project focused on what happens when homeless people die in LA County. We heard some heartbreaking stories, but also managed to get a huge data set from the coroner's office that really helped us nail down the severity of this problem. We also went to Potter's Field at the LA County Cemetery where the unclaimed homeless are buried. |
A culture of abuse: How to avoid it before it's too late
|
My senior capstone project was one of the hardest articles I have ever written. I decided to look at the culture of abuse in women's collegiate athletics. Not only is a problem for almost every female athlete at some point in her career, even in subtle ways, but there is a stigma that makes it hard for athletes to talk about it.
I talked to a former athlete who was abused, and I dug through my own survey data and data from the NCAA. It was a tough topic, but I feel strongly it is a topic that needs to be addressed. |

|
Lahey's legacy: The good, the bad and the expensive
|
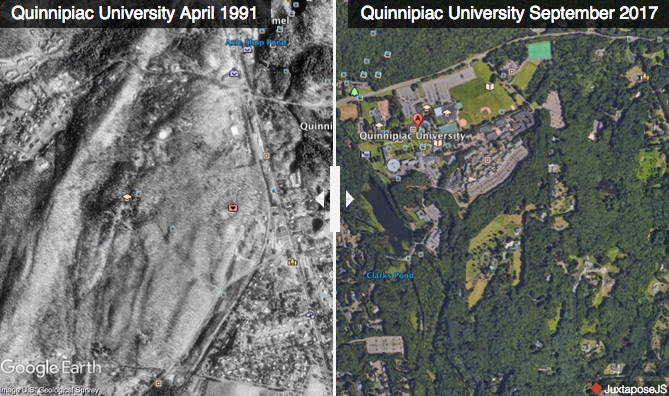
This was my final project for my data journalism class where we were tasked to come up with a data story based on some data set. I decided, since Quinnipiac's long-time president, John Lahey was retiring, that I would look at enrollment numbers, and finance numbers over the years at Quinnipiac. Little did I know, they would be near impossible to get.
After dozens of emails, I finally got the Quinnipiac annual reports from the library. But I had sit there and dig through 30 years of information (and take up a lot of space on my phone with pictures). It was actually very rewarding, though, and I ended up finding the numbers I needed, along with the help of the registrar. Also, I wanted to look at noise complaints from the Hamden Police Department, since there had been problems between the school and the town for years with off campus parties. The police department would only give me the data in hard copy form, so I got to use my newly-learned PDF scrapping tools, which was also frustrating, but rewarding. I learned a lot about what it takes sometimes to find the data you need for a story. So check it out! |
|
SEXUAL ASSAULT AWARENESS
|
In my senior capstone class, I wrote a story about sexual assault awareness month. I addressed what QU was doing to raise awareness about the issue, and where experts said they believed to be holes in the programming.
In my data journalism class I decided to kill two birds with one stone and create a moving graphic for an assignment that would align with the article I was writing for my capstone's class website. To the right is that graphic, which shows the number of people who have been accused of sexual misconduct since Harvey Weinstein. To create the graphic I had to cross reference multiple lists from different news sites, as many had some that other did not. |
|
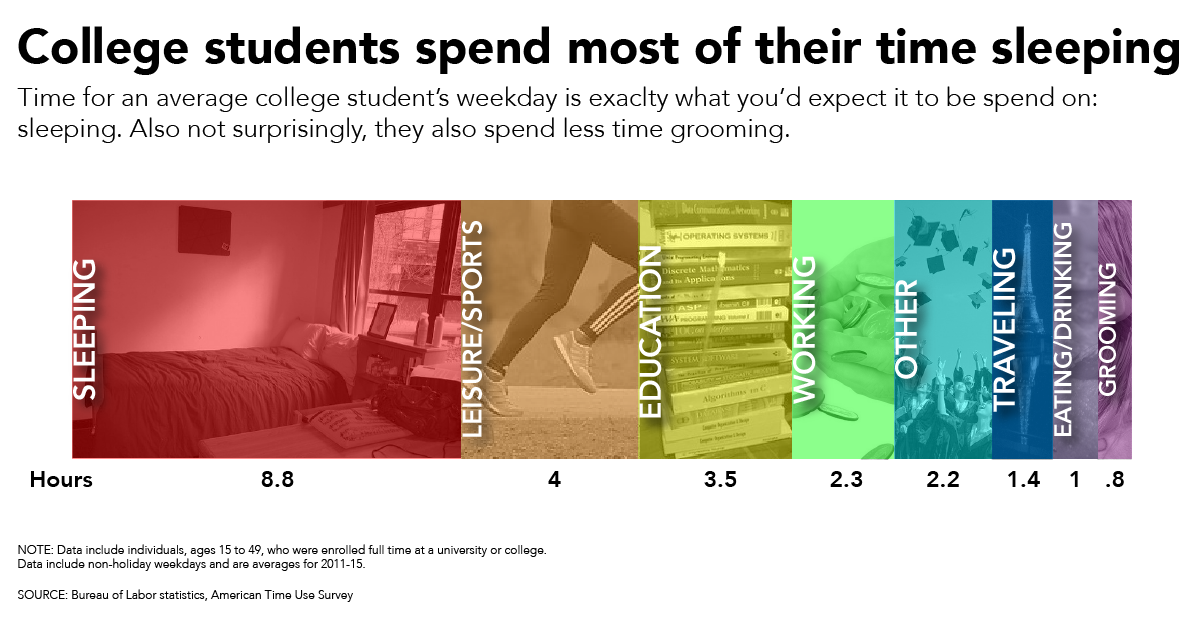
How college students spend their time
In my data journalism class we were tasked to create a chart using illustrator explaining how the Bureau of Labor Statistics's American Time Use Survey found college students were spending their time. I decided to do a more linear version of a pie chart, adding slightly opaque pictures just to give the graphic a little something extra to emphasize which activity students spent the most time doing. No surprise here -- it's sleeping.
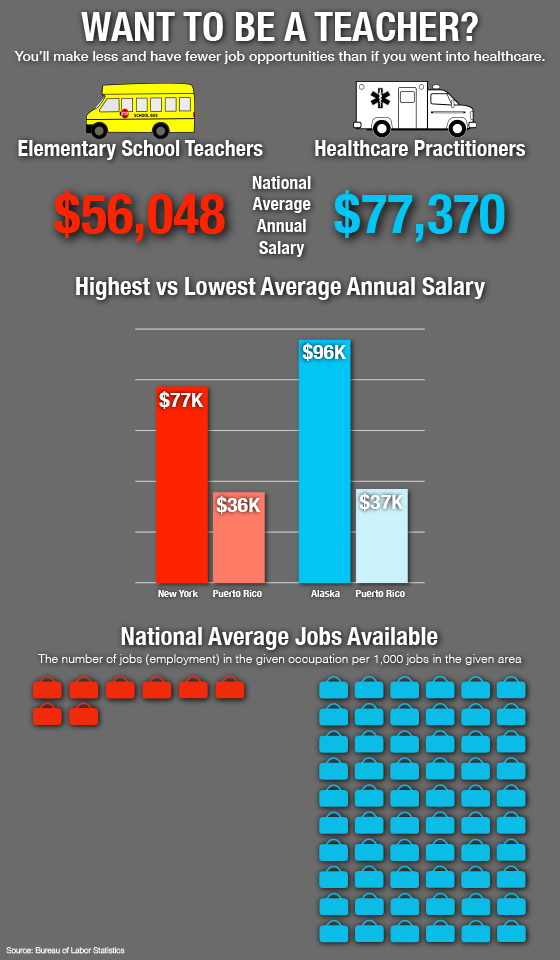
Comparison info graphic
Below is another project I made for my data journalism class. I was tasked to make an info graphic comparing any two things. I chose to focus of professions and used data from the Bureau of Labor Statistics. My sister's dream is to become a Kindergarten teacher, so I thought that I would compare a teacher to another, very different profession. I decided to look at the data and find one of the jobs with a very high rate of availability, because I have read multiple articles about teachers being laid off or not being able to find jobs at all. It turns out healthcare practitioners have a high average rate of availability.
Quinnipiack Valley Health district Project
Below is a map of all the restaurants in Hamden with a health rating by the QVHD. I, as part of a Journalism class at Quinnipiac University investigated the ins and outs of the rating system and the extra pressure it puts on inspectors and businesses alike.
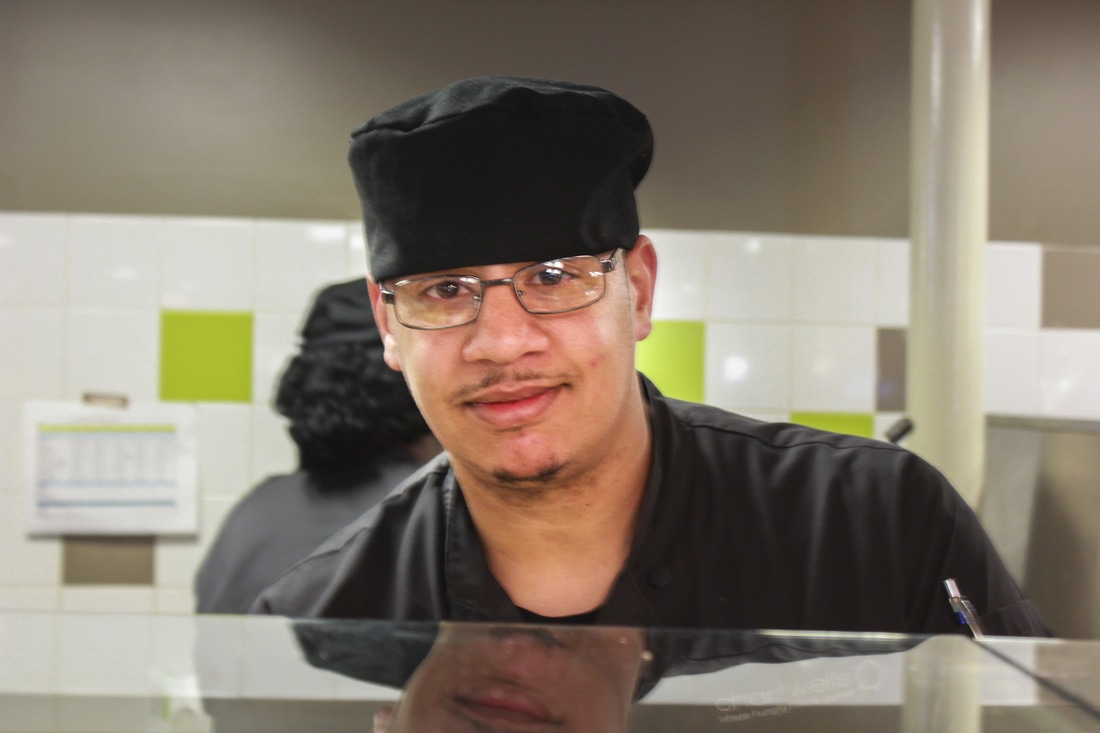
Lorenzo vincent profile
|
Lorenzo Vincent, a Chartwells cafeteria worker at Quinnipiac University is known for his speed and quality in his sandwich making abilities.
I got the opportunity to sit down with Vincent to learn a little more about his life before and during his time at Quinnipiac, as well as his thoughts about nutrition and student life. Click the photo to view Vincent's profile, as well as a collection of stories relating to nutrition in college. |
|
